MATRIX
Having selected an adapter, press the button Start and network starts to be scanned.
Results can be logged to a summary log (you can set path on a fold MAC layer log and
IP layer log). You can see only current part of the log on the screen. MAC layer log
records all valid packets that come to the interface. IP layer log records only valid IP
packets that come to the interface. Statistics is being created (fold Statistics), which
contain IP addresses, share of computer in bandwidth usage in percent and summary information
about number of packets and bytes of a particular computer.
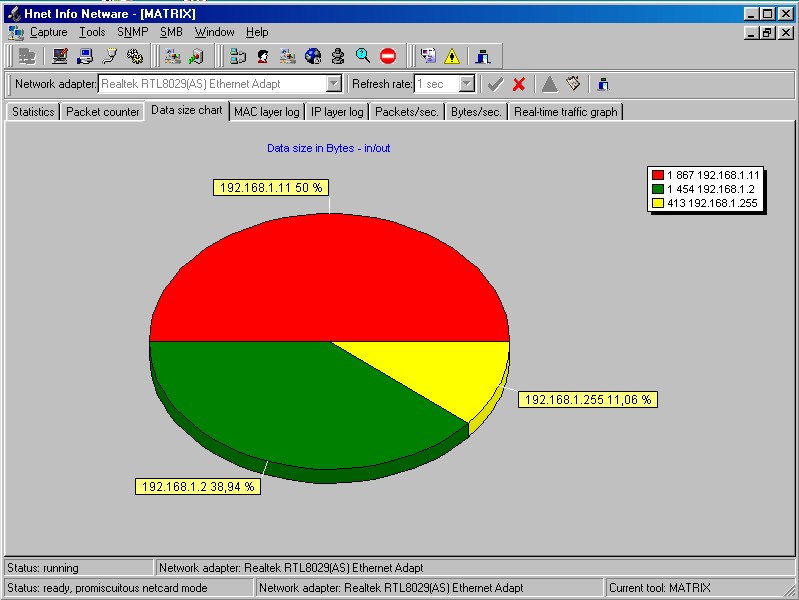
Created graphs: graph Packet counter
summarizes how many packets were sent or received by a single computer in comparison
to others. Data transmission graph summarizes share of single computers on bandwidth load.
Real-time graphs are also being created: packets/second, which summarizes how many packets
get to an interface and graph bytes/second, which shows how many bytes passed through the
scanned interface. A real-time transmission graph is also being created, showing the
station currently loads the network at most.
Selected interface is switched to promiscuity mode during scanning, so it is
able to catch all valid packets that get to appropriate network segment.
Statistics can be moved to Packet editor by the button Edit, where you can print it,
send it by mail or save it.